At ArcStone, we know all too well that it's crunch-time, but taking a step back is crucial to moving forward, especially at the end of the year. With the combo of BigCommerce and ArcStone's marketing expertise, we will find the best data to use as your guide for the next year. Tuesday Tip: quickly get an overview of your 2017 efforts – here's how.
-9.png?width=640&name=Tuesday%20Tip%20(1)-9.png)
First, a helpful provision. If the term 'analytics' completely overwhelms you, take a look at this offer from our team. They'll set you up with a custom Analytics dashboard and report that will help you finally track your efforts. We've helped several marketing teams take their digital efforts to the next level and as you make calculated decisions, this year analytics is essential. Learn more »
Start with your traffic report
If you're like the majority of digital marketers, the success of your efforts throughout the year can be seen in overall trends on your website, seeing as much of your social media, email, paid campaigns and otherwise work to drive traffic here.
To get an overview of what this looked like:
- Open your Google Analytics account.
- Select the dates (in the upper right) Jan. 1st 2017 – Dec. 31st 2017 (or today's date)
- Ask yourself, what are some trends? Any major spikes or drops in traffic? Did these align with your marketing efforts, editorial calendar, or billing? What were sales like during that time?
- Run a comparison in the date section, check the "Compare to" box and select "previous year" in the drop down if you'd like to compare year-over-year.
Let's use our site as an example. As you can see, we had an overall increase in sessions this year. We also had a spike in February and July.

Align your website's activity with your business practice
In a post by Natalie Barbour on BigCommerce, "3 Ways to Use Customer Data to Increase Conversions Right Now," marketors might get a bit of a wake up call! Just because your site traffic may have increased over the year, does not mean you're seeing a change in your conversions or sales. Users maybe visiting your website but are you converting them?
One area you can uncover why your site isn't converting is in your pages' exit rates. As Natalie put it,
"High-exit rate pages show you the place where your visitors decided not to become customers...In any case, the first key to discovering what made them leave is in the place where they left from."
She points us to this data in Google Analytics...
High bounce rates:
- Go to "behavior" > "site content" > "all pages"
- Towards the right side of the page, find "% Exit" & click on that title to sort by this metric.
- This will show you which pages have the highest bounce rates.
- You can mostly ignore pages like confirmation or thank you pages, as those aren't meant to keep people on the page.
- The pages to hone in on would be landing pages you are sending people to from social media or email, your heavily-promoted blog posts or your "contact us" page.
Some other areas our team recommends checking out as well include...
Mobile traffic:
- Go to "audience" > "mobile" > "overview"
- Compare the desktop traffic to mobile.
- If your site isn't designed for mobile devices to easily (and we mean easily) interact with, you're likely losing out on a ton of traffic. Google's mobile-friendly update is a clear statement about the state of the web and one that as marketors, we all should be listening to.
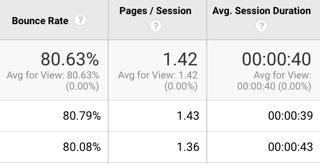
- Even if your site is mobile, make sure your numbers aren't drastically different between mobile and non-mobile users. Pay specific attention to bounce rates, time on page, and pages per session. If mobile engagement is low, you should put more consideration into designing pages and content with mobile usage top-of-mind.
As you can see in the screenshot below, the numbers aren't much different between desktop and mobile, as this site is designed for all devices.

Channels:
- On the side navigation panel in Google Analytics go to "aquisition" > "overview" > "all traffic" > "channels"
- Ask yourself, where are people mostly coming from? Which channels provide the traffic with the highest session duration and/or lowest bounce rates?
- If you put a lot of energy or resources into one channel this year, is it performing as well as you'd like? How valuable is this effort to your business?
Adjust your 2018 strategy with 2017 in the dust
This overview barely skimmed the surface of a full-on Year in Review, but we kept our promise of only taking about 30 minutes of your time! Though it's more beneficial to keep checking your analytics dashboard at more frequent intervals, a year-over-year comparision is a great step back that can provide an excellent view of your major efforts.
The most important next step to this activity should be to gather a better understanding of how your website connects with your business practice, and assessing how well you're converting visitors to your website into happy customers. For help with that, chat with us at ArcStone.
Cheers to 2018!